Current Senators
Official Results of the 2012 Senate Elections
Compare to our Final Forecast, view our Closest Scenario, and view an analysis of the battleground states.
| Party | Dem + Ind | Rep | |
|---|---|---|---|
| Senate Seats | |||
| Party | Dem | Rep | Ind |
| Senate Seats | |||
Our
Swing Scenario:
| Party | Dem + Ind | Rep | |
|---|---|---|---|
| Expected Seats | |||
| Safe Seats | |||
| Standard Deviation | |||
| Prob. 51+ Seats | |||
| Prob. 60+ Seats | |||
| Probability of Tie | |||
| Party | Dem | Rep | Ind |
| Expected Seats | |||
| Safe Seats | |||
| Standard Deviation | |||
| Prob. 51+ Seats | - | ||
| Prob. 60+ Seats | - | ||
How Did We Do?
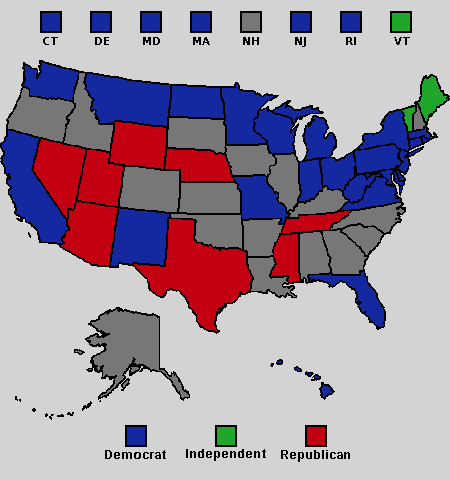
The 2012 United States Senate elections are now history, with the Democratic Party retaining majority control of the Senate.
Our model correctly predicted 31 of the 33 Senate races. In the Neutral swing scenario, the expected number of Senate seats for the Democrats and Independents was 53.6, while 55 were actually achieved. This discrepancy corresponds to an error of 1.87 standard deviations (based on a standard deviation of 0.75). The Strong Democratic swing scenario was the closest to the actual results, predicting 53.9 Senate seats for the Democrats and Independents.
All 19 of the so-called non-battleground states were predicted correctly. The remaining 14 battleground states are analyzed in the following table (under the neutral swing scenario):
All of these races, except for Montana and North Dakota, were correctly predicted.


