
Official Results of the 2012 Presidential Election
Compare to our Final Forecast, view our Closest Scenario, and view an analysis of the battleground states.
| Candidate | ||
|---|---|---|
| Electoral Votes |
Our
Swing Scenario:
| Candidate | ||
|---|---|---|
| Expected Electoral Votes | ||
| Safe Electoral Votes | ||
| Standard Deviation | ||
| Probability of Winning | ||
| Probability of Getting 300 Electoral Votes | ||
| Probability of Tie | ||
| Candidate | ||
|---|---|---|
| Expected Electoral Votes | ||
| Safe Electoral Votes | ||
| Standard Deviation | ||
| Probability of Winning | ||
| Probability of Getting 300 Electoral Votes | ||
| Probability of Tie | ||
How Did We Do?
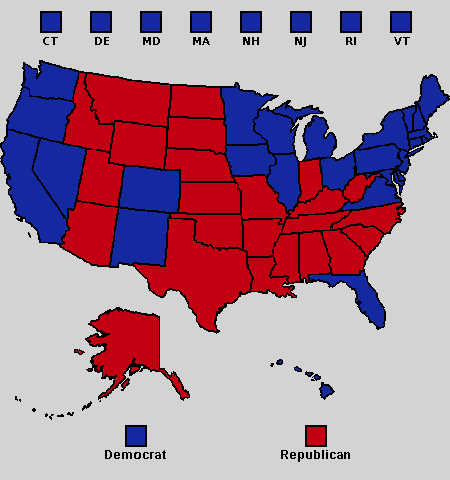
The 2012 United States Presidential Election is now history, and our nation has re-elected President Barack Obama as the 44th President of the United States.
Our model correctly predicted 50 of the 51 states (including the District of Columbia). In the Neutral swing scenario, the expected number of Electoral College votes for President Obama was 304.0, while 332 were actually achieved. This discrepancy corresponds to an error of 2.11 standard deviations (based on a standard deviation of 13.30). The Strong Democratic swing scenario was the closest to the actual results, predicting 309.3 Electoral College votes for President Obama.
All 40 of the so-called non-battleground states were predicted correctly. The remaining 11 battleground states are analyzed in the following table (under the neutral swing scenario):
All of these states, except Florida, were correctly predicted.


